Monitoring and troubleshooting tools
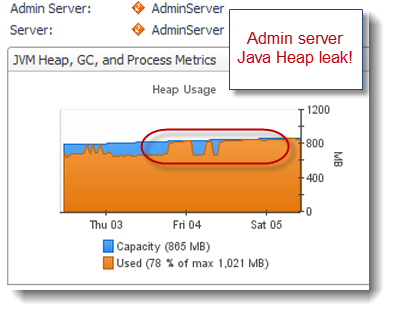
The Quest Foglight Java EE monitoring tool was quite useful to identify a Java Heap leak from our Weblogic Admin server. As you can see below, the Java Heap memory is growing over time.
If you are not using any monitoring tool for your Weblogic environment, my recommendation to you is to at least enable verbose:gc of your HotSpot VM. Please visit my Java 7 verbose:gc tutorial on this subject for more detailed instructions.
Step #2 – Generate a Heap Dump from your leaking JVM
Following the discovery of a JVM memory leak, the goal is to generate a Heap Dump file (binary format) by using the Sun JDK jmap utility.
** please note that jmap Heap Dump generation will cause your JVM to become unresponsive so please ensure that no more traffic is sent to your affected / leaking JVM before running the jmap utility **
This command will generate a Heap Dump binary file (heap.bin) of your leaking JVM. The size of the file and elapsed time of the generation process will depend of your JVM size and machine specifications / speed.

For our case study, a binary Heap Dump file of ~ 2 GB was generated in about 1 hour elapsed time.
Sun HotSpot 1.5/1.6/1.7 Heap Dump file will also be generated automatically as a result of a OutOfMemoryError and by adding -XX:+HeapDumpOnOutOfMemoryError in your JVM start-up arguments.
Step #3 – Load your Heap Dump file in Memory Analyzer tool
It is now time to load your Heap Dump file in the Memory Analyzer tool. The loading process will take several minutes depending of the size of your Heap Dump and speed of your machine.


Step #4 – Analyze your Heap Dump
The Memory Analyzer provides you with many features, including a Leak Suspect report. For this case study, the Java Heap histogram was used as a starting point to analyze the leaking objects and the source.

For our case study, java.lang.String and char[] data were found as the leaking Objects. Now question is what is the source of the leak e.g. references of those leaking Objects. Simply right click over your leaking objects and select >> List Objects > with incoming references

As you can see, javax.management.ObjectName objects were found as the source of the leaking String & char[] data. The Weblogic Admin server is communicating and pulling stats from its managed servers via MBeans / JMX which create javax.management.ObjectName for any MBean object type. Now question is why Weblogic 9.2 is not releasing properly such Objects…
Root cause: Weblogic javax.management.ObjectName leak!
Following our Heap Dump analysis, a review of the Weblogic known issues was performed which did reveal the following Weblogic 9.2 bug below:
This finding was quite conclusive given the perfect match of our Heap Dump analysis, WLS version and this known problem description.
Conclusion
I hope this tutorial along with case study has helped you understand how you can pinpoint the source of a Java Heap leak using jmap and the Memory Analyzer tool.
Reference
http://www.javacodegeeks.com
- Quest Foglight (JVM and garbage collection monitoring)
- jmap (hprof / Heap Dump generation tool)
- Memory Analyzer 1.1 via IBM support assistant (hprof Heap Dump analysis)
- Platform type: Middle tier
The Quest Foglight Java EE monitoring tool was quite useful to identify a Java Heap leak from our Weblogic Admin server. As you can see below, the Java Heap memory is growing over time.
If you are not using any monitoring tool for your Weblogic environment, my recommendation to you is to at least enable verbose:gc of your HotSpot VM. Please visit my Java 7 verbose:gc tutorial on this subject for more detailed instructions.

Step #2 – Generate a Heap Dump from your leaking JVM
Following the discovery of a JVM memory leak, the goal is to generate a Heap Dump file (binary format) by using the Sun JDK jmap utility.
** please note that jmap Heap Dump generation will cause your JVM to become unresponsive so please ensure that no more traffic is sent to your affected / leaking JVM before running the jmap utility **
1 | format=b |
Sun HotSpot 1.5/1.6/1.7 Heap Dump file will also be generated automatically as a result of a OutOfMemoryError and by adding -XX:+HeapDumpOnOutOfMemoryError in your JVM start-up arguments.
Step #3 – Load your Heap Dump file in Memory Analyzer tool
It is now time to load your Heap Dump file in the Memory Analyzer tool. The loading process will take several minutes depending of the size of your Heap Dump and speed of your machine.
Step #4 – Analyze your Heap Dump
The Memory Analyzer provides you with many features, including a Leak Suspect report. For this case study, the Java Heap histogram was used as a starting point to analyze the leaking objects and the source.
For our case study, java.lang.String and char[] data were found as the leaking Objects. Now question is what is the source of the leak e.g. references of those leaking Objects. Simply right click over your leaking objects and select >> List Objects > with incoming references
As you can see, javax.management.ObjectName objects were found as the source of the leaking String & char[] data. The Weblogic Admin server is communicating and pulling stats from its managed servers via MBeans / JMX which create javax.management.ObjectName for any MBean object type. Now question is why Weblogic 9.2 is not releasing properly such Objects…
Root cause: Weblogic javax.management.ObjectName leak!
Following our Heap Dump analysis, a review of the Weblogic known issues was performed which did reveal the following Weblogic 9.2 bug below:
- Weblogic Bug ID: CR327368
- Description: Memory leak of javax.management.ObjectName objects on the Administration Server used to cause OutOfMemory error on the Administration Server.
- Affected Weblogic version(s): WLS 9.2
- Fixed in: WLS 10 MP1
This finding was quite conclusive given the perfect match of our Heap Dump analysis, WLS version and this known problem description.
Conclusion
I hope this tutorial along with case study has helped you understand how you can pinpoint the source of a Java Heap leak using jmap and the Memory Analyzer tool.
Reference
http://www.javacodegeeks.com
No comments:
Post a Comment